Keywordsai adoption and valueBlogai for workai at workworkplace aiai for professionalshow to use ai at workai productivity
Related searchesai roi at workmeasuring ai productivitywhy ai pilots failhow to adopt ai in a teamai value from process redesignai adoption and value
The gap between a successful demo and a useful quarter
Most organisations can now point to a pilot that worked. Someone in operations drafted emails faster. A finance analyst summarised a pack overnight. A product manager turned meeting notes into an action list before lunch. Those episodes are real, and they are not a strategy. They sit at the bottom of a value curve that only steepens when the work around the model is redesigned: which data the model may see, which tools it may call, which steps a person still owns, and how the team measures whether the new path is better than the old one.
This chapter applies the programme thesis to adoption. Isolated task automation is useful. Process redesign, grounded data, tool access and named accountability are what turn a workshop into an operating system. Skip that distinction and you report activity while missing value.
Evidence beats enthusiasm. Hours saved and errors caught are the pair of measures this series uses throughout. A glowing workshop score does not tell you whether the work got cheaper, cleaner, faster, larger or more inventive.
Three levels of AI value
Treat adoption as a stack of three levels, not as a single “roll-out”. Each level is legitimate. Each produces a different slope. The mistake is to fund the first level, measure it as if it were the third, and then declare that AI does not pay.
| Level | What people actually do | Typical gain | What it does not change |
|---|---|---|---|
| Task pilots | Draft an email, summarise a document, rewrite a slide | Modest time back on isolated chores | Handoffs, data quality, review load, cycle time of the whole job |
| Workflow redesign | Rewrite a sequence: intake, draft, check, decide, file | Shorter cycle time and fewer dropped steps | Still limited if the model has no reliable data or tools |
| Process, data and tools | Approved model plus classified data plus tools the model can use, inside a named workflow | Compounding: reuse, fewer incidents, scale without linear headcount | Still requires a human owner for every output that leaves the building |
A task pilot asks whether a person can do a chore faster with a chatbot. A redesigned workflow asks whether the job can finish in fewer steps with fewer defects. The compounding level asks whether the department can run a repeatable system in which model, data, tools and review reinforce one another. Those questions need different sponsors, metrics and calendars.
The compounding curve over a quarter
The chart below is the argument in one picture. Over a quarter, isolated task pilots produce a shallow line. People save minutes on drafts, then spend those minutes on more of the same work. Workflow redesign lifts the curve because the sequence itself changes: fewer handoffs, a standard review, a clearer “done”. The steep line is process plus data plus tools. Prompts are reused. Retrieval sits on an approved corpus. The model can look up a ticket, a policy clause or a spreadsheet range instead of inventing one. Review effort falls because the input is constrained. Defects that used to arrive as surprises become visible earlier.
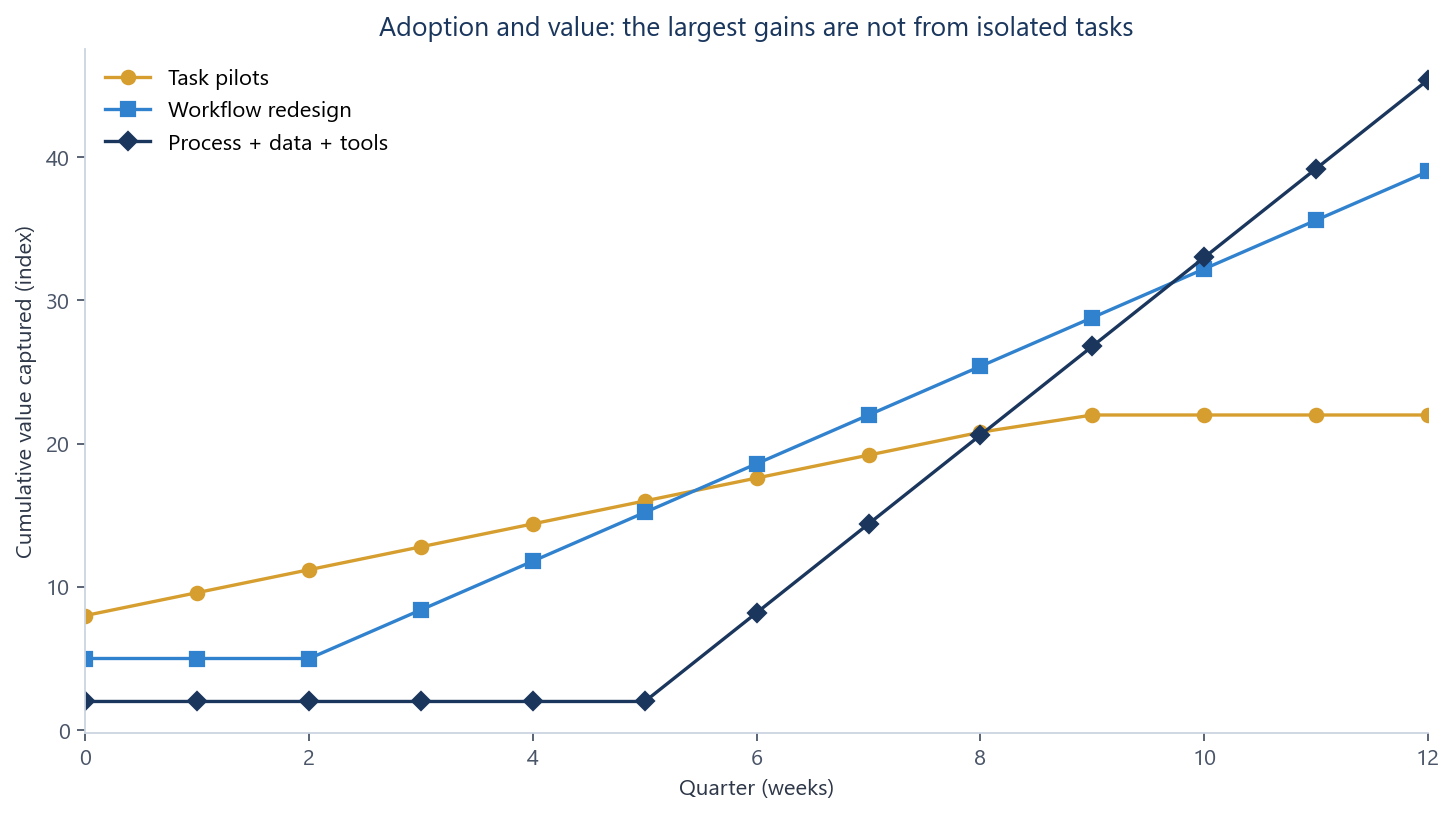
Read the chart as a warning about timing as well as height. The compounding line does not jump in week one. Literacy, classified use and a baseline have to come first. Teams that demand a return in a fortnight will only fund task pilots, because that is the level that produces a quick anecdote. Teams that hold twelve weeks can measure cycle time, defect rate, and the share of work on approved tools.
If your board pack only contains before-and-after screenshots of an email draft, you are reporting the shallow line. Ask for the redesigned process and the two measures that sit on it.
Why isolated task pilots stay modest
Email drafting is the canonical pilot because it is low risk, easy to demonstrate and immediately felt. It is also a poor proxy for departmental value. The time to write a first draft is rarely the bottleneck in knowledge work. The bottlenecks are waiting for the right facts, reconciling versions, chasing a decision, and repairing errors that escaped into a customer or a regulator. Speeding the draft without touching those constraints moves a small slice of a large job.
Task pilots also hide review cost. A person who used to write for twenty minutes and send may now generate in two minutes and edit for fifteen. That can still be a gain. It can also be a wash, or a loss, if the generated draft is fluent, slightly wrong, and expensive to check. Fluency is not evidence. Chapter 3 covered hallucination; chapter 10 covered complementary labour. Adoption has to price the human check as part of the work, not as an embarrassment to be omitted from the business case.
A third reason pilots stall is local optimisation. One person gets faster at a personal chore while the queue, the template, the system of record and the reviewer stay unchanged. Departmental cycle time barely moves. Leaders then conclude that AI is incremental when they have only measured an incremental intervention.
Workflow redesign is the middle step most programmes skip
Redesign starts with a single job, written as a sequence a stranger could follow. Who requests the work? What must be true before anyone starts? Where do facts live? Who drafts, who checks, who decides, who files? Which of those steps is slow because of typing, and which is slow because of missing information, unclear ownership or rework?
AI belongs on the steps where language, structure or search is the constraint, and only after you have named the check that follows. A claims handler might use a model to extract fields from a letter, then a human confirms the fields against the policy, then a system of record is updated by a tool rather than by retyping. That is a different design from “paste the letter into a chatbot and hope”. The second version is a task pilot. The first is a workflow with a model in it.
Teams that skip this step try to scale prompting. They circulate clever instructions and wonder why cycle time does not fall. Prompt quality matters — chapter 4 is the method — but a good prompt inside a broken sequence still produces a faster mess.
Do not automate a queue you have not mapped. If nobody can draw the current path on one page, a model will only accelerate confusion.
Model, data, tools and workflow: the compounding stack
Chapter 8 put the same stack in technical language: a model plus retrieval plus tools plus a workflow the organisation actually runs. Adoption is where that stack either becomes a budget line or remains a slide. The model on its own is a text engine. Data that is classified, current and permitted to be retrieved is what stops the engine inventing. Tools — a ticket system, a document store, a calculator, an approved search — are what stop it pretending it has acted. Workflow is what stops a clever demonstration from becoming twelve conflicting personal methods.
Compounding is reuse. The second run already has a prompt library. The third has a corrected corpus. The fourth has a shorter review because known failures are checked by tools rather than memory. None of that happens if every use is a fresh chat with a public model and a unique instruction. A licence is only the model layer. Without data rules, tool access and a workflow with an owner, you have purchased a large number of task pilots. Some will be excellent. The curve will still be shallow.
Department brief — one process only
Process: monthly management pack for Region North
Owner: Head of FP&A (named)
Model: approved enterprise assistant only
Data: last closed month from the warehouse; no live customer files
Tools: retrieval over the pack template and the KPI dictionary; spreadsheet formulas in Excel, not in chat
Workflow: extract variance comments → human edits numbers → AI critiques the narrative → controller signs
Baseline before week 9: cycle time, late comments, numerical errors found after circulation
Success at week 12: same pack, shorter cycle, equal or lower defect rate, prompts reused by at least three people
Measure hours saved and errors caught
Slide 51 of the programme, and the practice chapter that follows this one, use a deliberately small pair of measures: hours saved and errors caught. They are not the only numbers a company will ever need. They are the numbers that keep a team honest while enthusiasm is still doing most of the talking.
Hours saved must be hours on the job you redesigned, net of review. If a two-hour drafting task becomes thirty minutes of generation and fifty minutes of checking, you saved forty minutes, not ninety. If those forty minutes are immediately filled with more low-value work of the same kind, the department has not recovered capacity. It has raised throughput of a chore. That can still be a goal — scale is a legitimate value type — but it is not efficiency. Say which one you wanted.
Errors caught is the quality counterpart. Count defects the new path finds before the work leaves, and defects it introduces that review then repairs. The net is what matters. A process that saves an hour and ships two extra mistakes is not a win. A process that saves twenty minutes and catches a regulatory error may be, depending on the incident cost you would otherwise have paid.
| Measure | How to capture it weekly | What it prevents you from claiming |
|---|---|---|
| Hours saved | Baseline minutes for the job, minus generation plus review | That a faster first draft is the same as a cheaper process |
| Errors caught | Defects found before release, minus defects the AI introduced | That fluency equals correctness |
| Cycle time | Request to signed output, including waits | That personal speed equals departmental speed |
| Incident cost avoided | Severity of errors that would have escaped, priced from last year’s incidents | That quality is a soft benefit with no money attached |
Keep the log boring. A shared sheet with date, process, hours, errors, and a one-line note is enough for ninety days. Dashboards can wait until the log has survived contact with a real month.
Five value types, two primary levers
Chapter 1 distinguished five ways AI can pay: efficiency, quality, speed, scale and innovation. All five are real. A team that tries to harvest all five at once will measure none of them, because every trade-off can be explained away as progress on a different axis. Pick two primary levers for the quarter. Treat the others as welcome side-effects, not as success criteria.
| Lever | What “better” means | A clean test |
|---|---|---|
| Efficiency | The same output with fewer hours, net of review | Hours per signed pack fall and defect rate does not rise |
| Quality | Fewer defects, better reasoning, less rework after release | Errors caught before circulation rise; incidents after circulation fall |
| Speed | Shorter elapsed time from request to decision | Cycle time falls even if hours per person stay similar |
| Scale | More volume without a matching rise in headcount | Throughput rises; quality holds at the new volume |
| Innovation | Options you would not have had time to examine | A decision uses a comparison or pre-mortem that previously did not exist |
A customer-operations team might choose quality and speed. A research team might choose innovation and quality. An FP&A team might choose efficiency and quality. The combination is a strategy. “All of the above” is a slogan.
Write the two levers at the top of the ninety-day plan. If a proposed use of AI does not move one of them, it is a personal convenience, not a departmental project.
ROI pitfalls that make good work look like failure, or bad work look like success
The first pitfall is counting time saved that is immediately filled with more low-value work. If drafting is faster and the inbox simply grows, you have not recovered capacity. You have lowered the cost of producing more of the same. That can be scale. It is not efficiency. Finance should ask where the hours went. If they went into work the department had already decided was low value, the return is imaginary.
The second is ignoring review time. Generated text is cheap. Checking it is not, especially when the draft is confident and the error is local. A serious ROI model includes the minutes of a qualified reviewer and the delay if that reviewer is scarce. Some processes will still pay. Some will not. You cannot tell which until review is on the stopwatch.
The third is ignoring incident cost. A leaked customer file, a wrong number in a board pack, or a hallucinated legal citation can erase a year of modest time savings. Chapter 9 treated classification and accountability as operating rules, not as legal colour. Adoption has to price the incident you are trying not to have. If the new path reduces those incidents, that avoided cost is part of the return. If the new path raises them, no amount of drafting speed will save the case.
A quieter pitfall is attributing to AI a gain that came from finally writing the process down. Mapping a workflow, agreeing a template and naming an owner often help before a model is involved. Take a baseline after the process is clear, not only after the chatbot arrives.
Change management: permission, modelling and fear
Tools do not adopt themselves. People adopt tools when it is allowed, when it is shown, and when it does not look like a prelude to redundancy. Those three conditions are more predictive of uptake than model quality.
Permission has to be specific. “You may use the approved assistant on green and yellow data, with the classification card on your desk” is permission. “Be innovative, but do not put anything confidential anywhere” is a riddle. People resolve riddles by going around the policy. Manager modelling matters because staff watch what is actually done in the meeting, not what is written on the portal. If a director pastes a client memo into a public chatbot while telling the team to wait for training, the team has received its real instruction.
Champions are useful when they are practitioners. A champion who runs the redesigned process, shares surviving prompts, and reports hours and errors without theatre gives colleagues a path they can copy. Appoint one or two people per team who already do the work, give them time in the first four weeks, and let them teach from their log rather than from a vendor script.
Fear of job loss will not be argued away in a town hall. It falls when people can see which parts of the job are being redesigned and which judgements remain theirs. Chapter 10 is the operating model: the model drafts, critiques and searches; a named human verifies, decides and owns. Repeat that split until it is dull. Mystery feeds rumour.
Where fear is ignored, two failures appear. Some people refuse the tools and fall behind on cycle time. Others use them in secret, including on data they would never paste with a manager in the room. Both are adoption failures. Only one shows up in the licence dashboard.
Shadow AI is what you get when the policy is only “no”
A ban without an approved path does not stop use. It stops visibility. People still have deadlines. They still have a public model in another tab. They will paste. You will not see the paste, the prompt, the data class, or the error that followed. Shadow AI is not a morality tale about disobedient staff. It is the predictable result of a policy that names the risk and does not name the allowed method.
The remedy is not a louder ban. It is classified permission: here is the approved tool, here is what may go in, here is what must never go in, here is who reviews what. Chapter 9’s green, yellow and red card belongs on the desk during weeks five to eight of the plan below. When people can do the job inside the fence, most of them prefer the fence. The few who do not are then a conduct issue rather than a design issue.
If your only AI metric is “number of people trained”, you will miss shadow use entirely. Add the share of relevant work that runs on approved tools. A falling unofficial-use rumour mill is a qualitative signal worth writing down.
Governance as an enabler of adoption, not a blocker
Governance that only says no will be routed around. Governance that says “yes, like this” is what lets a department move from pilots to compounding. The job of risk, legal and security in this programme is to make the approved path the easiest path: a tool that is actually available, a classification rule that can be applied in seconds, a review step that is sized to the data class, and a named human for anything that leaves the building.
That stance changes the conversation with a sceptical control function. You are not asking them to relax a standard. You are asking them to specify it so work can proceed. Bring control partners in during weeks one to four, while literacy is being built, so the classified-use rules in weeks five to eight are theirs as well as yours. A policy published after people have already invented personal methods arrives as an insult.
A ninety-day adoption plan for a department
Twelve weeks is long enough to leave the shallow line and short enough to finish. One department, one process, two value levers, two measures. Expand only after week twelve has produced a log someone else can audit.
| Weeks | Focus | What “done” looks like |
|---|---|---|
| 1–4 Literacy | How models fail, RTCCOQ, classification, complementary labour | Every person has used the approved tool on public or green data; managers have modelled it in a real meeting |
| 5–8 Prompt libraries and classified use | Save prompts that earn their place; green, yellow, red on the desk; no public tools for yellow or red | A shared library with owners; a written rule for what never goes into a public model; review roles named |
| 9–12 One redesigned process | Baseline the chosen job; run the new sequence; log hours and errors | A before-and-after on cycle time and defects; prompts reused; a decision to keep, adjust or stop |
Weeks 1–4: literacy without theatre
Literacy is not a festival of demos. It is enough shared vocabulary to use the rest of the plan: models compose plausible language rather than retrieving truth; prompts are briefs; data has a class before it is pasted; a named human owns the output. Point people at chapters 2, 3, 4, 9 and 10. Practise on public material and green notes. Managers should use the tool in the open this month. Champions start their logs now. A log that begins in week nine will be gamed.
Weeks 5–8: libraries and classified use
Prompts that worked once should be written down with role, task, context, constraints, output and quality checks, plus an owner, a data class, and a note on when they failed. This is also the month the fence becomes real: approved tools only for yellow data; red data stays out unless a separate control pattern exists. If the approved tool is slow or missing, fix that here.
Weeks 9–12: one process, baseline first
Choose a job that already repeats. Write the current sequence. Time it. Count defects from the last month if you have them. Then change one path — intake, draft, check, decide, file — with the model and tools in the places you chose. Run it for at least four cycles. Compare hours, errors and cycle time with the baseline. Decide in writing: keep, adjust, or stop. Stopping is a successful use of evidence.
Week 9 baseline (example)
Process: customer complaint write-up, standard product defects
Volume: 12 cases in the sample fortnight
Mean hours per case today: 1.6 (including review)
Defects after release, last month: 4 (wrong remedy quoted twice; missing apology once; wrong account once)
Primary levers this quarter: quality and speed
AI path from week 9: retrieve policy + prior similar cases → draft write-up → human verifies remedy and figures → send
Off limits: live payment data, identity documents, anything red
An executive dashboard that does not lie to you
Once a department has a log, leadership needs indicators that cannot be satisfied by theatre. Five are enough: share of relevant work on approved tools; prompts reused; cycle time on the chosen process; defect rate; training coverage of the people who actually do the work.
| Indicator | Healthy pattern by week 12 | Unhealthy pattern |
|---|---|---|
| Share of work on approved tools | Rising; rumours of unofficial tools falling | Licences issued, unofficial use unchanged |
| Prompts reused | A short library in daily use by more than one person | Hundreds of chats, no shared prompt with an owner |
| Cycle time | Down on the chosen process, waits included | Drafting faster, end-to-end time unchanged |
| Defect rate | Flat or down, with review time counted | Fewer hours, more escapes, review skipped |
| Training coverage | The people who do the process, not only the volunteers | A high completion rate on a course nobody applies |
Do not add vanity counts — number of prompts, seats, or “AI ideas” in a hopper — until these five are stable. Vanity is how a shallow curve is made to look steep in a steering pack.
A useful board sentence: “On process X, cycle time fell from A to B, net hours from C to D, defects from E to F, with G per cent of that work on the approved tool and N prompts reused.” If you cannot say that sentence, you are not ready to scale the story.
What a department should stop doing
Stop running disconnected vendor demos while the chosen process has no baseline. Stop measuring adoption as attendance. Stop announcing a ban without an approved tool that works. Stop asking every team to “find use cases” without two levers and an owner. Stop celebrating time saved that reappeared as more of the same low-value output. Start with one job, two measures, a classification rule, and a manager who will use the approved tool in front of other people.
Key takeaways
- Task pilots create modest value. Workflow redesign creates more. Model, data, tools and workflow compound.
- Measure hours saved, net of review, and errors caught. Evidence beats enthusiasm.
- Pick two value levers from efficiency, quality, speed, scale and innovation, or you will measure nothing.
- ROI fails when saved time is refilled with low-value work, when review is ignored, or when incident cost is left off the page.
- Champions, manager modelling and specific permission beat a policy that is only “no”. Shadow AI is a design failure.
- Governance enables adoption when it specifies the allowed path. A model never carries responsibility.
- Ninety days: literacy, then libraries and classified use, then one redesigned process with a baseline.
- The executive dashboard is approved-tool share, prompt reuse, cycle time, defect rate and training coverage.
The next chapter turns this from a departmental plan into personal practice: thirty days on real work, a prompt library you can copy, and the guardrails that keep the log honest.